System Administration

Cleaning Up Memory Usage

I noticed my Ubuntu desktop was using a rather large portion of available memory.  I usually have a lot running on my system, multiple terminals, background jobs, etc so this is nothing unusual.  Today however I noticed my system was sluggish so I started digging.  Memory use was near 100%.  I closed all of my programs to see what effect that would have but the memory usage stayed very high ~90%.  I started to suspect a memory leak in one of the processes or programs I was running.  I really didn’t want to reboot the system since it isn’t a Windows desktop!  What to do.  I needed to force memory cleanup on the system.  How do I analyze the memory usage on a system?  I thought I would document a few of the ways to see memory use.

You can use commands like ‘top’ and ‘vmstat’ to get an idea of what your system is chewing on.  Specifically looking at memory I tend to use:

watch -n 1 free -m

For a more detailed look use:

watch -n 1 cat /proc/meminfo

If you suspect a program of having a leak you can use valgrind to dig even deeper:

valgrind --leak-check=yes program_to_test

‘valgrind’ is great for testing however not to helpful with currently running processes or without some experience.

So you analyze the system and determine there is memory that has not been properly freed, what do you do?  You can reboot but that isn’t always an option.  You can force clear the cache doing the following:

sudo sysctl -w vm.drop_caches=3

This frees up unused but claimed memory in Ubuntu a (and most linux flavors).  This command won’t affect system stability and performance, it will just clean up memory used by the Linux Kernel on caches.  That said I have noticed the system is more responsive (contradiction, you decide).  Here is an example of how much memory you can free up with this command:

$ free
             total       used       free     shared    buffers     cached
Mem:      16287672   15997176     290496       5432     404120   14415648
-/+ buffers/cache:    1177408   15110264
Swap:      4093884          0    4093884
[msaba@nfc ~]$ sudo sysctl -w vm.drop_caches=3
[sudo] password for msaba: 
vm.drop_caches = 3
[msaba@nfc ~]$ free
             total       used       free     shared    buffers     cached
Mem:      16287672     948076   15339596       5432       1268      92708
-/+ buffers/cache:     854100   15433572
Swap:      4093884          0    4093884

Another command that can free up used or cached memory (inodes, page cache, and ‘dentries’):

sudo sync && echo 3 | sudo tee /proc/sys/vm/drop_caches

I have not seen any significant difference between the results of this or the first command.

I’ll add updates to this page as I think of them.  Good luck for now.
vi & vim aids

For my quick reference.

To open two files in vi/vim and edit side by side (use CTRL-W + w to switch between the files):

# vim -O foo.txt bar.txt

To open a file and automatically move the cursor to a particular line number (for example line 80)

# vi +80 ~/.ssh/known_hosts

To display line numbers along the left side of a window, type one of the following command while using vi/vim:

:set number

or

:set nu

Here is how to cut-and-paste or copy-and-paste text using a visual selection in Vim.

Cut and paste:

  1. Position the cursor where you want to begin cutting.
  2. Press v to select characters (or uppercase V to select whole lines).
  3. Move the cursor to the end of what you want to cut.
  4. Press d to cut (or y to copy).
  5. Move to where you would like to paste.
  6. Press P to paste before the cursor, or p to paste after.

Copy and paste is performed with the same steps except for step 4 where you would press y instead of d:

  • d = delete = cut
  • y = yank = copy


Denyhosts Assists

Every so often a legitimate user will get blocked by deny hosts.  When this happens you can re-enable their access with these 8 simple steps (UPDATE: or use the faster version, see below):

  1. Stop DenyHosts
    # service denyhosts stop
  2. Remove the IP address from /etc/hosts.deny
  3. Edit /var/lib/denyhosts/hosts and remove the lines containing the IP address.
  4. Edit /var/lib/denyhosts/hosts-restricted and remove the lines containing the IP address.
  5. Edit /var/lib/denyhosts/hosts-root and remove the lines containing the IP address.
  6. Edit /var/lib/denyhosts/hosts-valid and remove the lines containing the IP address.
  7. Edit /var/lib/denyhosts/users-hosts and remove the lines containing the IP address.
  8. Consider adding the IP address to /etc/hosts.allow
    sshd:  IP_Address
  9. Start DenyHosts
    # service denyhosts start

That’s it, your user should be able to access the server again.

The above process was a bit tedious however I am leaving it there because it gives details about what files are involved.  Since doing the above is time consuming here is what I have been doing that is much easier:

  1. Stop DenyHosts
    # service denyhosts stop
  2. Remove the IP address from /etc/hosts.deny
    1. # sed -i '/IP_ADDRESS/d' /etc/hosts.deny
  3. Remove all entries found under /var/lib/denyhosts/ containing the IP address.
    1. # cd /var/lib/denyhosts
      # for i in *hosts*;do sed -i '/IP_ADDRESS/d' "$i";done
  4. Consider adding the IP address to /etc/hosts.allow
    sshd:  IP_Address
  5. Start DenyHosts
    # service denyhosts start


Testing Database Connectivity

Working with databases and new application installations can be really fun.  Problem is, when there is a problem, everyone starts the blame game.  Nothing unusual about that, part of an administrators job is to troubleshoot and prove where the problem starts.  When dealing with external databases, there can be numerous problem, the firewall could be blocking, the local or remote port could be blocked on the system, or the database credentials could be incorrect.  Testing for the last helps troubleshoot all of these.  Ruling out the database connection helps focus the application administrator on the real problem!  Testing a remote oracle database is pretty simple if you have the oracle client configured with tnsnames, etc.  But if that isn’t necessary you may not have it configured.  When you don’t this is the easiest way to test the database connection via the command line:

sqlplus 'user/pass@(DESCRIPTION=(ADDRESS=(PROTOCOL=TCP)(Host=hostname.network)(Port=1521))(CONNECT_DATA=(SID=remote_SID)))'

Prior to this make sure your ORACLE_HOME environment variable is set correctly.  You may also need the LD_LIBRARY_PATH set to $ORACLE_HOME/lib.

UPDATE: 21may2015:

Now that you are in you may want to check a few things out.  To give you a quick reminder of the syntax here are a few to get the lay of the land:

To list all tables in a database (accessible to the current user):

SQL> select table_name from user_tables;


To list the contents of a specific table, type:

SQL> select * from name_of_table;

You can find more info about views all_tablesuser_tables, and dba_tables in Oracle Documentation.


Pain often equals Progress

It has been one of those weeks.  Not fun, to many hours worked, personal events missed, you know the kind of week I am talking about.  If not…what do you do for a living?!

Despite all the pain and stress this week has resulted in Progress, an increased understanding of certain products and new ways to use old tools.  I won’t share the details of my story, just insert yours here, but I will share/document the lessons and commands I learned or rediscovered.  Here we go…

Starting a long running process from home last night around 9PM and forgetting to start screen…priceless!  At 5:30AM this morning the process was still chugging along, with from my calculations would be running for another 18+ hours.  Off to work with no way to grab the terminal (an ssh session), what to do?  Why use strace of course!  Here is how:

strace -pPROCESS_PID -s9999 -e write

ie: strace -p3918 -s9999 -e write

Now even if my ssh session dies at home, I can still see the process output and know when it finishes and if it had any problems.  Yes, I could have piped output to a file, you never forgot anything after working for 15+ hours?

Dealing with a system that had some package inconsistencies and a yum update that failed, followed by a package-utils –cleandupes that erased many complete packages, I thought about using the ‘yum history’ command to revert the system until I read this: “Use the history option for small update rollbacks.”  Here are some of the commands I used which due to the systems package inconsistencies did not perform as expected.

# yum check
# package-cleanup --cleandupes
# yum-complete-transaction
# yum check
# package-cleanup --problems
# rpm -Va --nofiles --nodigest
# yum distribution-synchronizatio

The rest is pretty standard stuff, at least not worth noting in this post.  The end result this week is a lot of lessons learned and a much deeper understanding for an application that I support on my server.  In all, ignoring the backlog, I’d say that is what progress looks like.


SSH – weak ciphers and mac algorithms

A security scan turned up two SSH vulnerabilities:

SSH Server CBC Mode Ciphers Enabled
SSH Weak MAC Algorithms Enabled

To correct this problem I changed the /etc/sshd_config file to:

# default is aes128-ctr,aes192-ctr,aes256-ctr,arcfour256,arcfour128,
# aes128-cbc,3des-cbc,blowfish-cbc,cast128-cbc,aes192-cbc,
# aes256-cbc,arcfour
# you can removed the cbc ciphers by adding the line

Ciphers aes128-ctr,aes192-ctr,aes256-ctr,arcfour256,arcfour128,arcfour

# default is hmac-md5,hmac-sha1,hmac-ripemd160,hmac-sha1-96,hmac-md5-96
# you can remove the hmac-md5 MACs with

MACs hmac-sha1,hmac-ripemd160

Once that was done and sshd was restart, you can test for the issue like this:

#ssh -vv -oCiphers=aes128-cbc,3des-cbc,blowfish-cbc <server>
#ssh -vv -oMACs=hmac-md5 <server>

Best to test before and after so you are familiar with the output.

The Root of Missing Mail

Like all conscientious system administrator I like to keep tabs on my servers.  One way of doing this is checking root’s email daily.  This is a great idea if you have a few servers and never take vacation!  I manage close to 100 servers, so I need a more efficient way of “hearing” my servers when they complain to root about something.  Aside from monitoring solution (not covered here) the best way to do this is to redirect where email for the root user gets sent.

This seems pretty simple so I never thought of posting about this, until today.  Some facts , to forward mail for the root user leverage the /etc/aliases file.  Like always I added a line to /etc/aliases like this:

# vi /etc/aliases

     root:    myemailaddress@uconn.edu

Ideally you want to set the email address to a list serve so that your backup administrator receives these messages also, so you can take a vacation.

I made that change yesterday on a new server and didn’t give it a second thought.  Today no mail, and I know there was an error on the system?!

First thing I checked was if I could send mail from the server, I could have…or I just forgot because I am sleep deprived…  I was able to send mail from the command line to an email address but not to an alias.  OK, that is a big clue.

While I have never had to do this before, (perhaps I restarted all my other systems?), regardless to fix the problem I simply ran this command:

# newaliases

Bingo, mail started flowing!

If that doesn’t fix it for you, other things to check are:

– Include the following in your /etc/hosts.allow:

ALL: 127.0.0.1 : allow


Remember when you issued that command…?

Bash History: Display Date And Time For Each Command

When working in a clustered environment where sometimes documentation gets written past, it is often helpful to know when you issued certain commands. The bash history is great except it doesn’t include a date/time stamp by default. Here is how to add one:

To display the time and date of with previously executed commands in your history, you need to set the “HISTTIMEFORMAT” variable. The variable has to be set in the users profile file so to take effect on each session. You define the environment variable in your bash profile as follows:

$ echo 'export HISTTIMEFORMAT="%d/%m/%y %T "' >> ~/.bash_profile

Where,
%d – Day
%m – Month
%y – Year
%T – Time
To see history type

$ history

Sample outputs:

....
  932  10/12/13 10:48:16 lsof -i
  933  10/12/13 10:49:55 tcpdump -i eth0 src host 137.99.xx.xx
  934  10/12/13 10:50:53 tcpdump -i eth0 src host 137.99.xx.xx port 8080
  935  10/12/13 10:51:10 tcpdump -i eth0 src host 137.99.xx.xx 
  936  10/12/13 10:52:42 ss -ln
....

References:

For more info type the following commands:

man bash
help history
man 3 strftime

That is it…

Running the Citrix Reciever on Linux

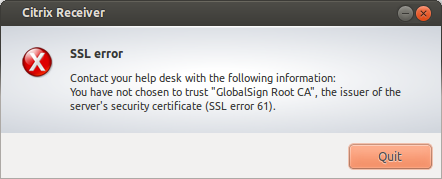
Setting up a new linux workstation and after installing the Citrix Receiver and attempting to start a module (Outlook) I got the dread SSL error:

citrix-receiver-ssl-errorHaving run into this every 6 months or so I decided it was time to jot down the fix.  The problem is the install does not install the Citrix SSL certificate into the browsers trusted certificate cache. So here is the solution for Firefox…

To prevent the SSL error 61 when accessing remote sessions:

Make Firefox’s certificates accessible to Citrix,

sudo ln -s /usr/share/ca-certificates/mozilla/* /opt/Citrix/ICAClient/keystore/cacerts

That’s it, you should be good to go!

Flush This!

I came across this today and learned something new so thought I would share it here.

After killing 2 processes that had hung I noticed the following in the ps output:

root       373     2  0 Jun11 ?        00:00:00 [kdmflush]
root       375     2  0 Jun11 ?        00:00:00 [kdmflush]
root       863     2  0 Jun11 ?        00:00:00 [kdmflush]
root       867     2  0 Jun11 ?        00:00:00 [kdmflush]
root      1132     2  0 Jun11 ?        00:01:03 [flush-253:0]
root      1133     2  0 Jun11 ?        00:00:43 [flush-253:2]

Now kdmflush I am use to seeing, but flush-253: was something I had never noticed so I decided to dig.  I started with man flush but that seemed to lead no where since I am not running sendmail or any mail server.  I turned to google (not to proud to admit it) and searched “linux process flush”.  Turns out ‘flush-# is kernel garbage collection that flushes unused memory allocations to disk so the RAM can be reused.  So ‘flush’ is trying to write out dirty pages from virtual memory, most likely associated with the processes I just killed.

I discovered these commands that shed more light on what is actually happening:

grep 253 /proc/self/mountinfo 
20 1 253:0 / / rw,relatime - ext4 /dev/mapper/vg_kfs10-lv_root rw,seclabel,barrier=1,data=ordered
25 20 253:3 / /home rw,relatime - ext4 /dev/mapper/vg_kfs10-lv_home rw,seclabel,barrier=1,data=ordered
26 20 253:2 / /var rw,relatime - ext4 /dev/mapper/vg_kfs10-LogVol03 rw,seclabel,barrier=1,data=ordered

Remember my listings were for flush-253:0 and flush-253:2 so I now know what partitions are being worked with.  Another interesting command to use is the following, which shows the activity of writing out dirty pages:

watch grep -A 1 dirty /proc/vmstat
nr_dirty 2
nr_writeback 0

If these numbers are significantly higher you might be having a bigger problem on your system.  Though from what I have read this sometimes indicates sync’ing.  If this becomes a problem on your server you can set system parameters in /etc/sysctl.conf to head this off by adding the following lines:

vm.dirty_background_ratio = 50
vm.dirty_ratio = 80

Then (as root) execute:

# sysctl -p

The “vm.dirty_background_ratio” tells at what ratio should the linux kernel start the background task of writing out dirty pages. The above increases this setting from the default 10% to 50%.  The “vm.dirty_ratio” tells at what ratio all IO writes become synchronous, meaning that we cannot do IO calls without waiting for the underlying device to complete them (which is something you never want to happen).

I did not add these to the sysctl.conf file but thought it worth documenting.